Contextualizing Alerts With Datadog and CloudWatch
So you’ve received an alert but do you know why? Get clarity by contextualizing alerts through response automation.

It’s 2:00 AM and your ringtone infiltrates your dreams. It’s a PagerDuty alert. Ok, so you know you’ve been alerted but do you know why? The only thing more frustrating than being awakened mid-sleep is not having the contextual information you need to know what’s what. Is this something that requires urgent action or simply an alert triggered by an outlier that is explainable because of seasonal load or another known situation? Not having this information immediately means issues that need urgent attention persist longer and ones that don’t keep engineers awake (or distracted from other projects) unnecessarily.
Without contextual alerting, engineers must immediately head to their monitoring tools to dig through data and pull metrics. This process plays out in individual interfaces, rather than a shared medium like Slack, meaning teammates could be looking at varied sets of data, coming to different conclusions, and aren’t collaborating within the context of the alert.
The solution isn’t just a set of one-off integrations into Slack but a fully integrated system that turns multiple manual steps into one codified process through response automation.
Transposit’s integrations with monitoring tools like Datadog and Amazon CloudWatch provide users with the context to quickly determine if immediate action is required. On-call engineers can instantly make sense of the alert and either head back to bed (fingers crossed) or have a clear direction for next steps to take.
Metrics to Help Solve Mysteries
For the most part, failure is inevitable. Monitoring tools allow engineers to figure out why applications/systems are behaving in a certain manner and then subsequently take active and real-time measures to resolve it. Metrics allow teams to derive an optimal baseline for systems and predict when something is about to go wrong and mitigate it before it blows up.
But not all failure scenarios are predictable; constant change happens within most systems, and unknown factors might also be at play. When the unexpected happens, engineers usually need to manually go through dashboards of historical metrics data or query data from monitoring tools to be able to pinpoint the time(s) at which a system exceeded the optimal baseline.
Unfortunately, context switching between tools can mean engineers lose the holistic view of the incident response. Plus, doing all of this manually eats up precious time. What if, instead of manually digging through various tools, those steps could all be automated straight from an alert?
CloudWatch and Datadog Integrations
Response automation through Transposit enables users to quickly, consistently, and collaboratively investigate and address alerts.
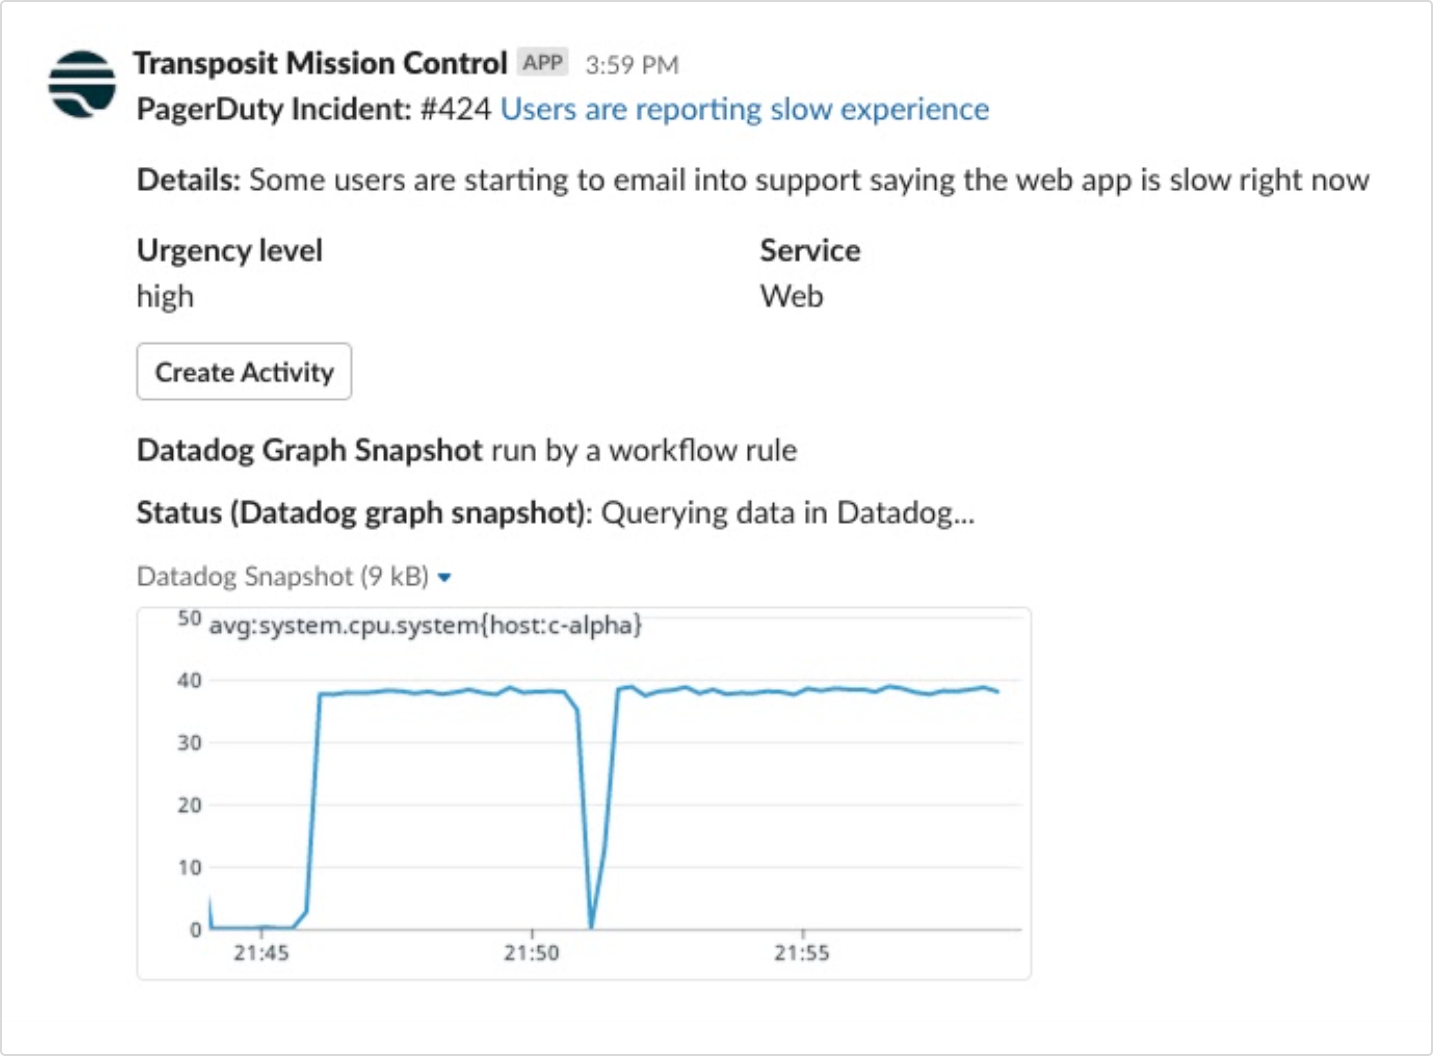
Runbooks can automatically pull CloudWatch or Datadog data into Slack based on an alert. For example, you may want to respond to an increased CPU utilization alert by fetching metrics dashboards within the timeline and context of an incident in Slack so teams can collaborate together and take action.
Transposit’s dedicated workflows for both Datadog and CloudWatch can be forked, then adapted and customized with available parameters for a suitable use case and/or time period.
The Datadog workflow can be used to query metrics snapshots for certain periods of time and get the graphs directly in Slack.
Transposit works similarly with Amazon CloudWatch to query CloudWatch metrics and get the results displayed in Slack.
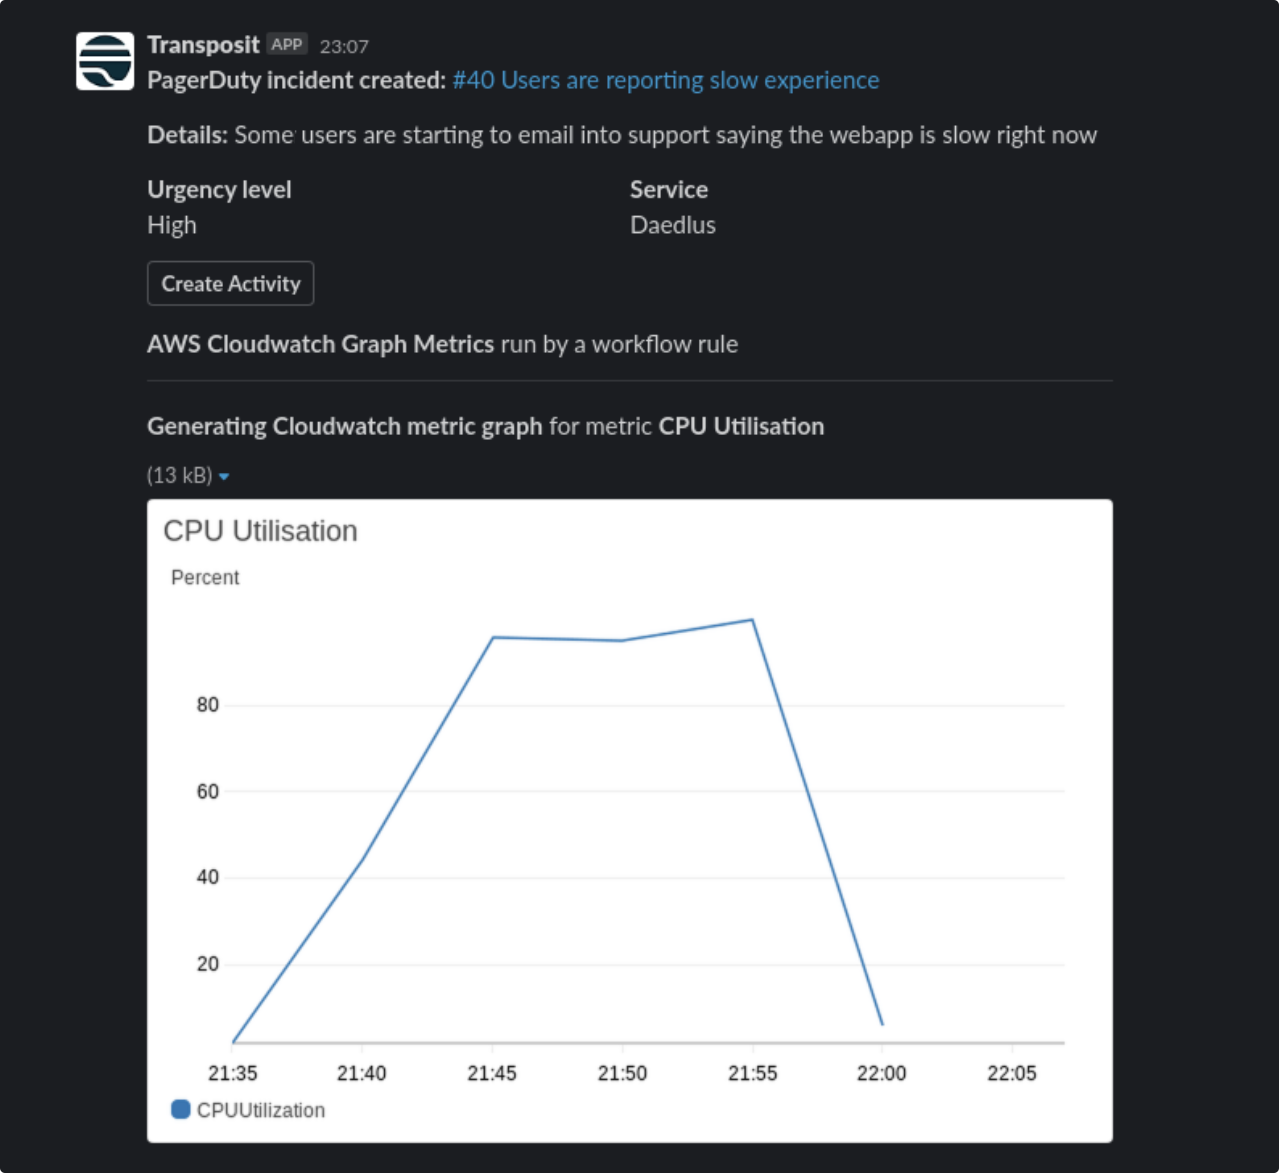
Teams are able to see in both graph metrics at what point the system CPU utilization exceeded the alert threshold and can check logs and/or tracing events to help find the issue and mitigate it. Plus, all of this is happening in a centralized place that promotes open communication and swift decision-making.
Automating these mitigating actions helps ease the workload for on-call teams during an incident. Relevant and valid information is already available and allows for informed decision making and helps resolve incidents faster.
Optimizing DevOps With Response Automation
This example of contextualizing alerts is just one of many ways to use response automation with Transposit. You have the tools, but stitching them together in a seamless and collaborative way is no easy task. At Transposit, our goal is to help teams streamline their DevOps practices by codifying and automating processes.
Learn how to uplevel alerts with Transposit’s PagerDuty integration.