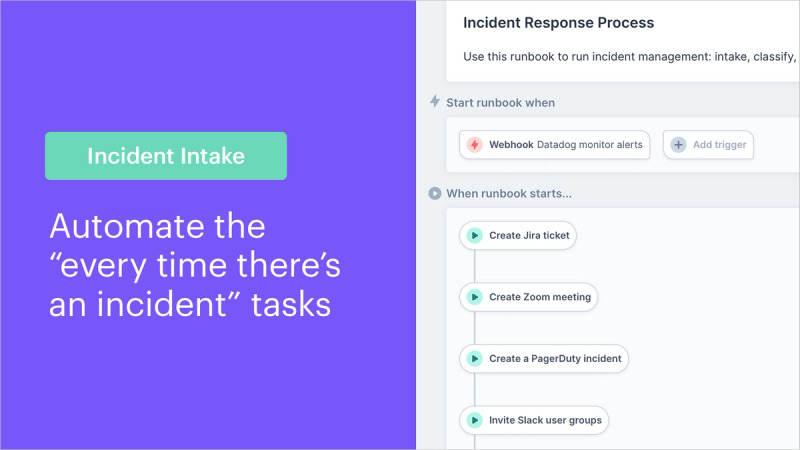
Classify Incidents Swiftly: Pull Data & Create Shared Context (All from Slack)
Gather data, create shared context, and take immediate action based on severity with human-in-the-loop automated workflows


Before engaging with stakeholders and taking remediation steps for an incident, it is crucial to understand the customer impact, be able to pull corresponding data, make informed decisions to assign a level of severity of the incident, and begin to prioritize and triage the situation accordingly.
Unfortunately, with an unpredictable volume and workload of incidents, this stage of incident management has always been a bottleneck for DevOps teams, as this tedious yet essential task lies in the critical path between detection and remediation — teams can’t decide remediation steps without first understanding impact. But beyond the tedium, there is a lot of pressure on the DevOps team to make correct decisions regarding severity and prioritization of incident remediation, depending on the stakes of the incident and its resolution.
Transposit helps teams more quickly gather the data needed to classify an incident, provide shared context with teammates, and ensure an audit trail of all actions. Classification is the second stage of the five-stage Transposit solution to simplifying and streamlining DevOps incident management.

In this stage, Transposit automates and unifies the process of aggregating and distributing the disparate necessary data logs, metrics, and other necessary statistical information for informed decision making. The approach blends full automation and human-in-the-loop automation to make sure the whole team can access the same data in synchrony while making decisions about addressing the incident.
The status quo: data siloed throughout systems
Once an incident is reported to an organization, the DevOps team is immediately on the clock. They need to digest the information related to the incident and determine the scale and scope of its impact — and the traditional way of doing this often eats away at time.
Typically, this stage can be characterized by:
- Manual tasks: This work is usually done manually using tools like AWS, CloudWatch, AppDynamics, Datadog, New Relic, and any number of others. Going to sources and digging through metrics to determine the impact is time-consuming, particularly when it involves metrics from multiple sources, as is often the case when investigating an incident for its severity.
- Lack of visibility: There is a lack of transparency in this process, depending on who is involved in the decision, or fragmentation, if different team members are independently pulling data related to the incident.
- No audit trail: Unless the incident manager manually downloaded or screenshotted the data being reviewed, the record of this information is likely forgotten, and short of explanations logged in productivity software, there is no paper trail of how the decision was reached. This can pose challenges in debriefs, or in justifying decisions regarding priority if there is any type of inquiry.
How Transposit solves these problems
Transposit enables teams to swiftly gather data and provide shared context with human-in-the-loop automated workflows. After automating the incident intake, teams will begin discovery to determine the impact of the failure or degradation. Groups will often look at customer contact volume (customer support and social media), user-level metrics such as failed versus successful requests, service performance, and more to determine the severity of an incident. Engineers can also use this contextual information to understand what is already known as they join the process. Generally, the more information gathered during classification, the better.

Human-in-the-loop automation: After the intake phase, most teams will bring humans in the loop to decide what type of data and information to pull. The operator can decide which metrics to pull, and with a single button, can pull information from one or more tools (through action grouping).
Shared context: Pulling logs, metrics, and graphs from tools like Cloudwatch, Datadog, BigPanda (or others) creates context by compiling a knowledge base of information related to the incident — customer contact volume, user-level metrics, service performance, and more — all of which is used to classify the incident based on its severity.
Automatic timelines (audit trail): This context is shared from within a Slack channel and via the automatic timeline. Upon determining and entering the level of urgency, additional resources may be brought into the fold via an automatically created Slack channel, including team members outside of engineering who may need to communicate with stakeholders for warnings, damage control, or other public relations optics. The data that is pulled is also stored within the incident and shared through the users’ preferred channels, be it Jira, Slack, or any other tool of the team’s choosing. Context and this paper trail are crucial, as they can be revisited throughout the incident remediation process in case other engineers need to join.
How It Works
When an incident gets created in Transposit, the severity is based on knowledge gathered when the incident started. Now that the team has a better understanding, they can change the severity of the incident if needed, based on data gathered in this classification stage.
Incidents are classified by severity, and in Transposit, those are based on “SEV” definitions. Lower-numbered severities (SEV0 and SEV1) are urgent and may require additional resources and vigilant communications to business stakeholders. Higher severity incidents (SEV2, SEV3, SEV4, and SEV5) are generally relegated for high priority bugs, low priority bugs, issues that engineers will address in future code changes, or known issues that impact customers but are not prioritized because impact and risk are lacking.
Creating the classification workflow is as simple as adding actions and conditions to the runbook body section. Transposit integrates with more than 200 external tools, including CloudWatch, Datadog, BigPanda, OpsGenie, PagerDuty, Statuspage, and Instatus to pull the specific types of data needed to help the incident commander properly classify the severity of the issue in question.
Set up the classification runbook section
The runbook body section is where we bring humans in the loop to decide on the next steps. In the runbook builder, you can add common actions that teams typically take during an incident investigation so the operator can quickly take action.

- Click + Button, and choose a button name on the right side.
- Then you can add one or more actions underneath. By grouping actions together under a button, the operator will only have one click to kick off multiple actions.
- Add more buttons for any other single action or group of actions
- Should you wish, you can also add Conditions under a button that can kick off further actions if a criterion is met.
Setting up severity-based workflows
After you’ve set the severity, then what? Here are some options:
- Continue with the same runbook and incident process
- Changing the incident severity could also potentially kick off another runbook if you’ve set the runbook Trigger to Activity update where New severity is one of [sev] (see below). For instance, you might have another runbook for Sev0 and Sev1 incidents that you’d like to automatically kick off once that severity has been set. Both runbooks can be attached to the current activity.

- You can also set up a runbook with sections for each priority, which could automatically set the activity severity. Therefore, clicking the button for “P0” (as seen in the image below) could kick off further actions, like emailing executives, notifying other teams, or starting a new Zoom bridge.

Using the classification workflow
When a runbook is run, actions can be taken from within Transposit or Slack. To find your runbook in Slack, use the common /transposit and click Runbook run. From there you can take any actions within your runbook, like pulling CloudWatch metrics.

Setting severity
Teams can update the activity in Slack with command /Transposit edit, or through Transposit itself.

What’s next
Following the intake and classification phases of the 5-step Transposit incident management solution, the structure is now in place to allow the actual process of unpacking and resolving the incident to begin. Follow along for our next blogs to learn how to use Transposit to engage, remediate, and report, record, & learn.