Prerequisites
- Create a Grafana account.
Available Actions
- Fetch panel graph - Fetches a rendered image of a specified Grafana panel, requiring the Grafana image renderer plugin
- Select dashboard - Selects a Grafana dashboard and returns its ID
- Select panel - Selects a Grafana panel and returns its ID
Before working with individual actions, such as the above, go to the Explore Templates tab in the Automation Hub, and check if a template that suits your needs already exists.
Set Up the Integration
Let's get started pulling data from Grafana into Transposit.
Make sure you're logged into Transposit, then click this link to open the Grafana settings dialog, enter a name and your Grafana Base URL, and click Save.
In the Integrations list, where your key is now included, click Authenticate.
Follow the instructions in the dialog to get your key.
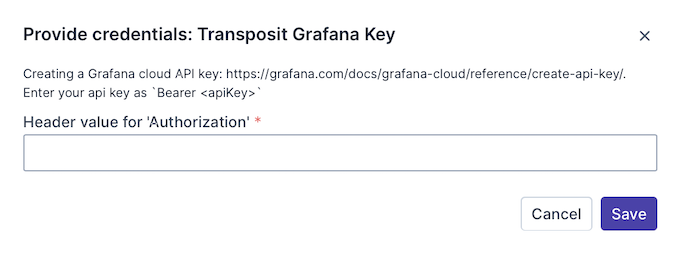
Useful link:
Enter the key received as described above and click Save.
In Grafana, enable the Grafana image renderer plugin. Use the same query parameters that you see in a URL when viewing a panel in the Grafana Web UI.
Use the Integration
Now that you've configured your integration, add one or more of the integration's actions to an automation, test the automation, and then add the automation to an incident type.
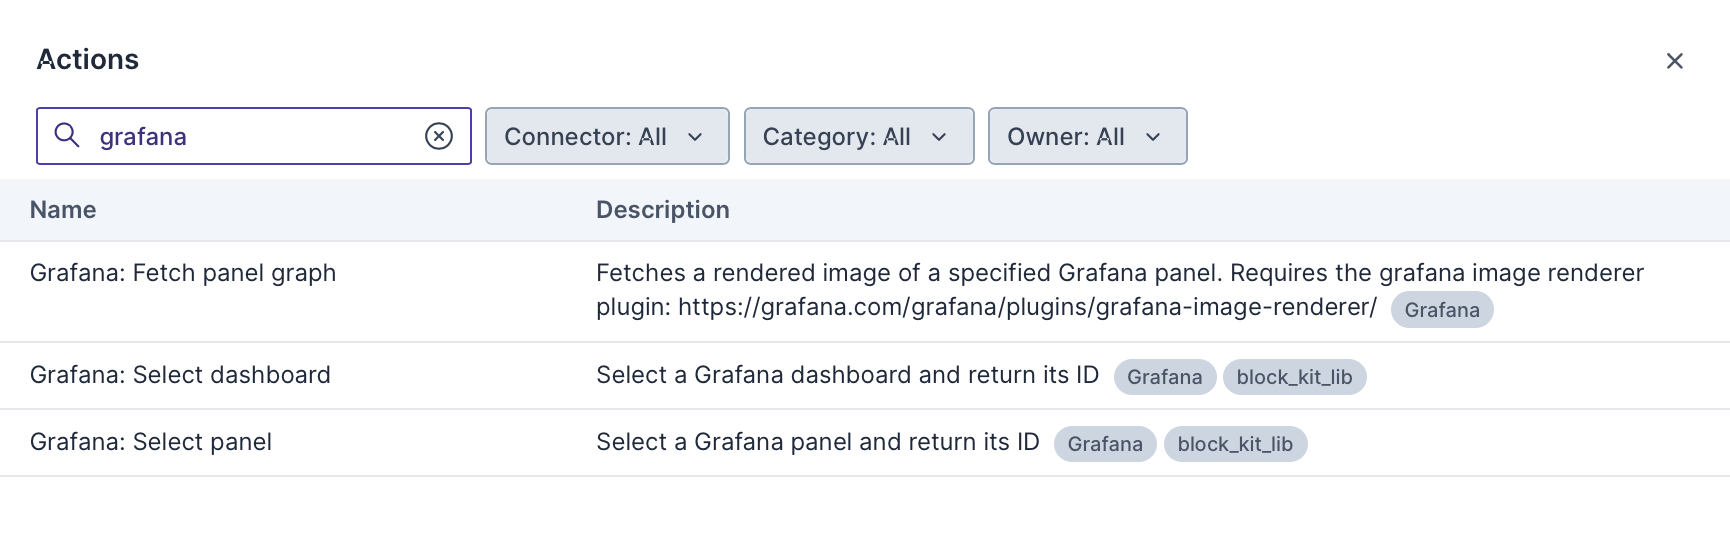
Add an Action. While creating your automations, when you search for Grafana actions, you see the following.
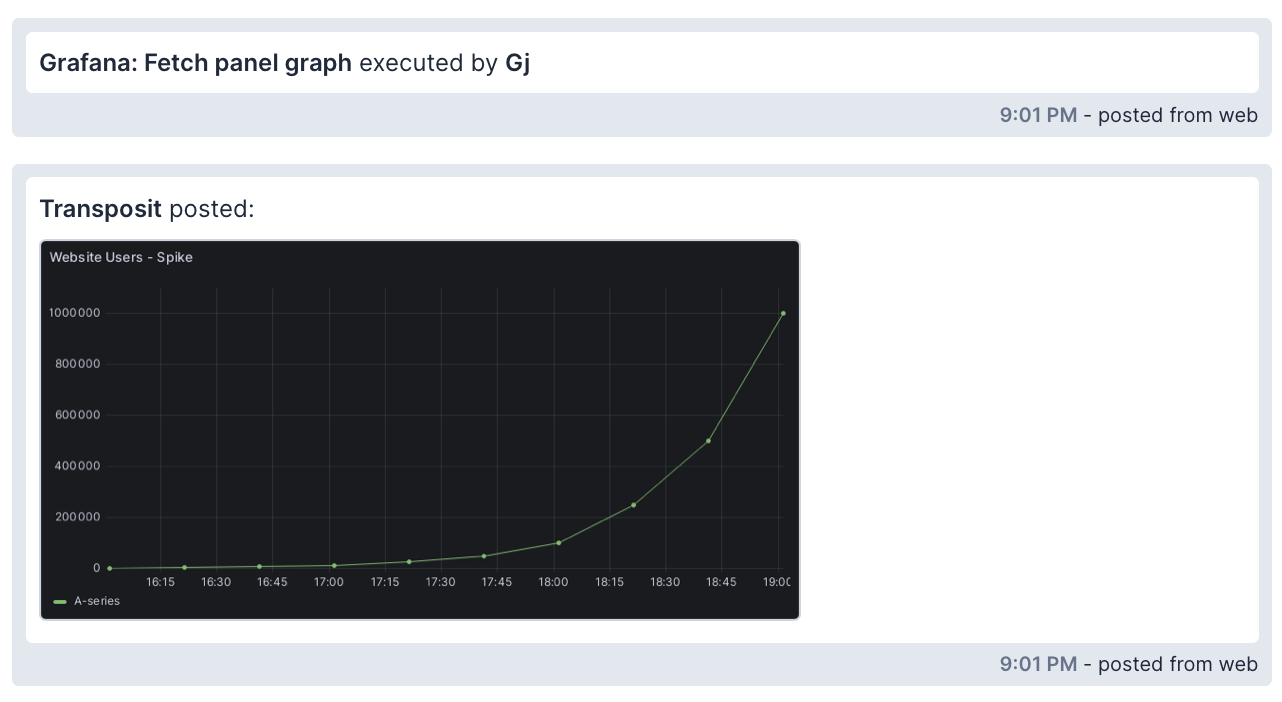
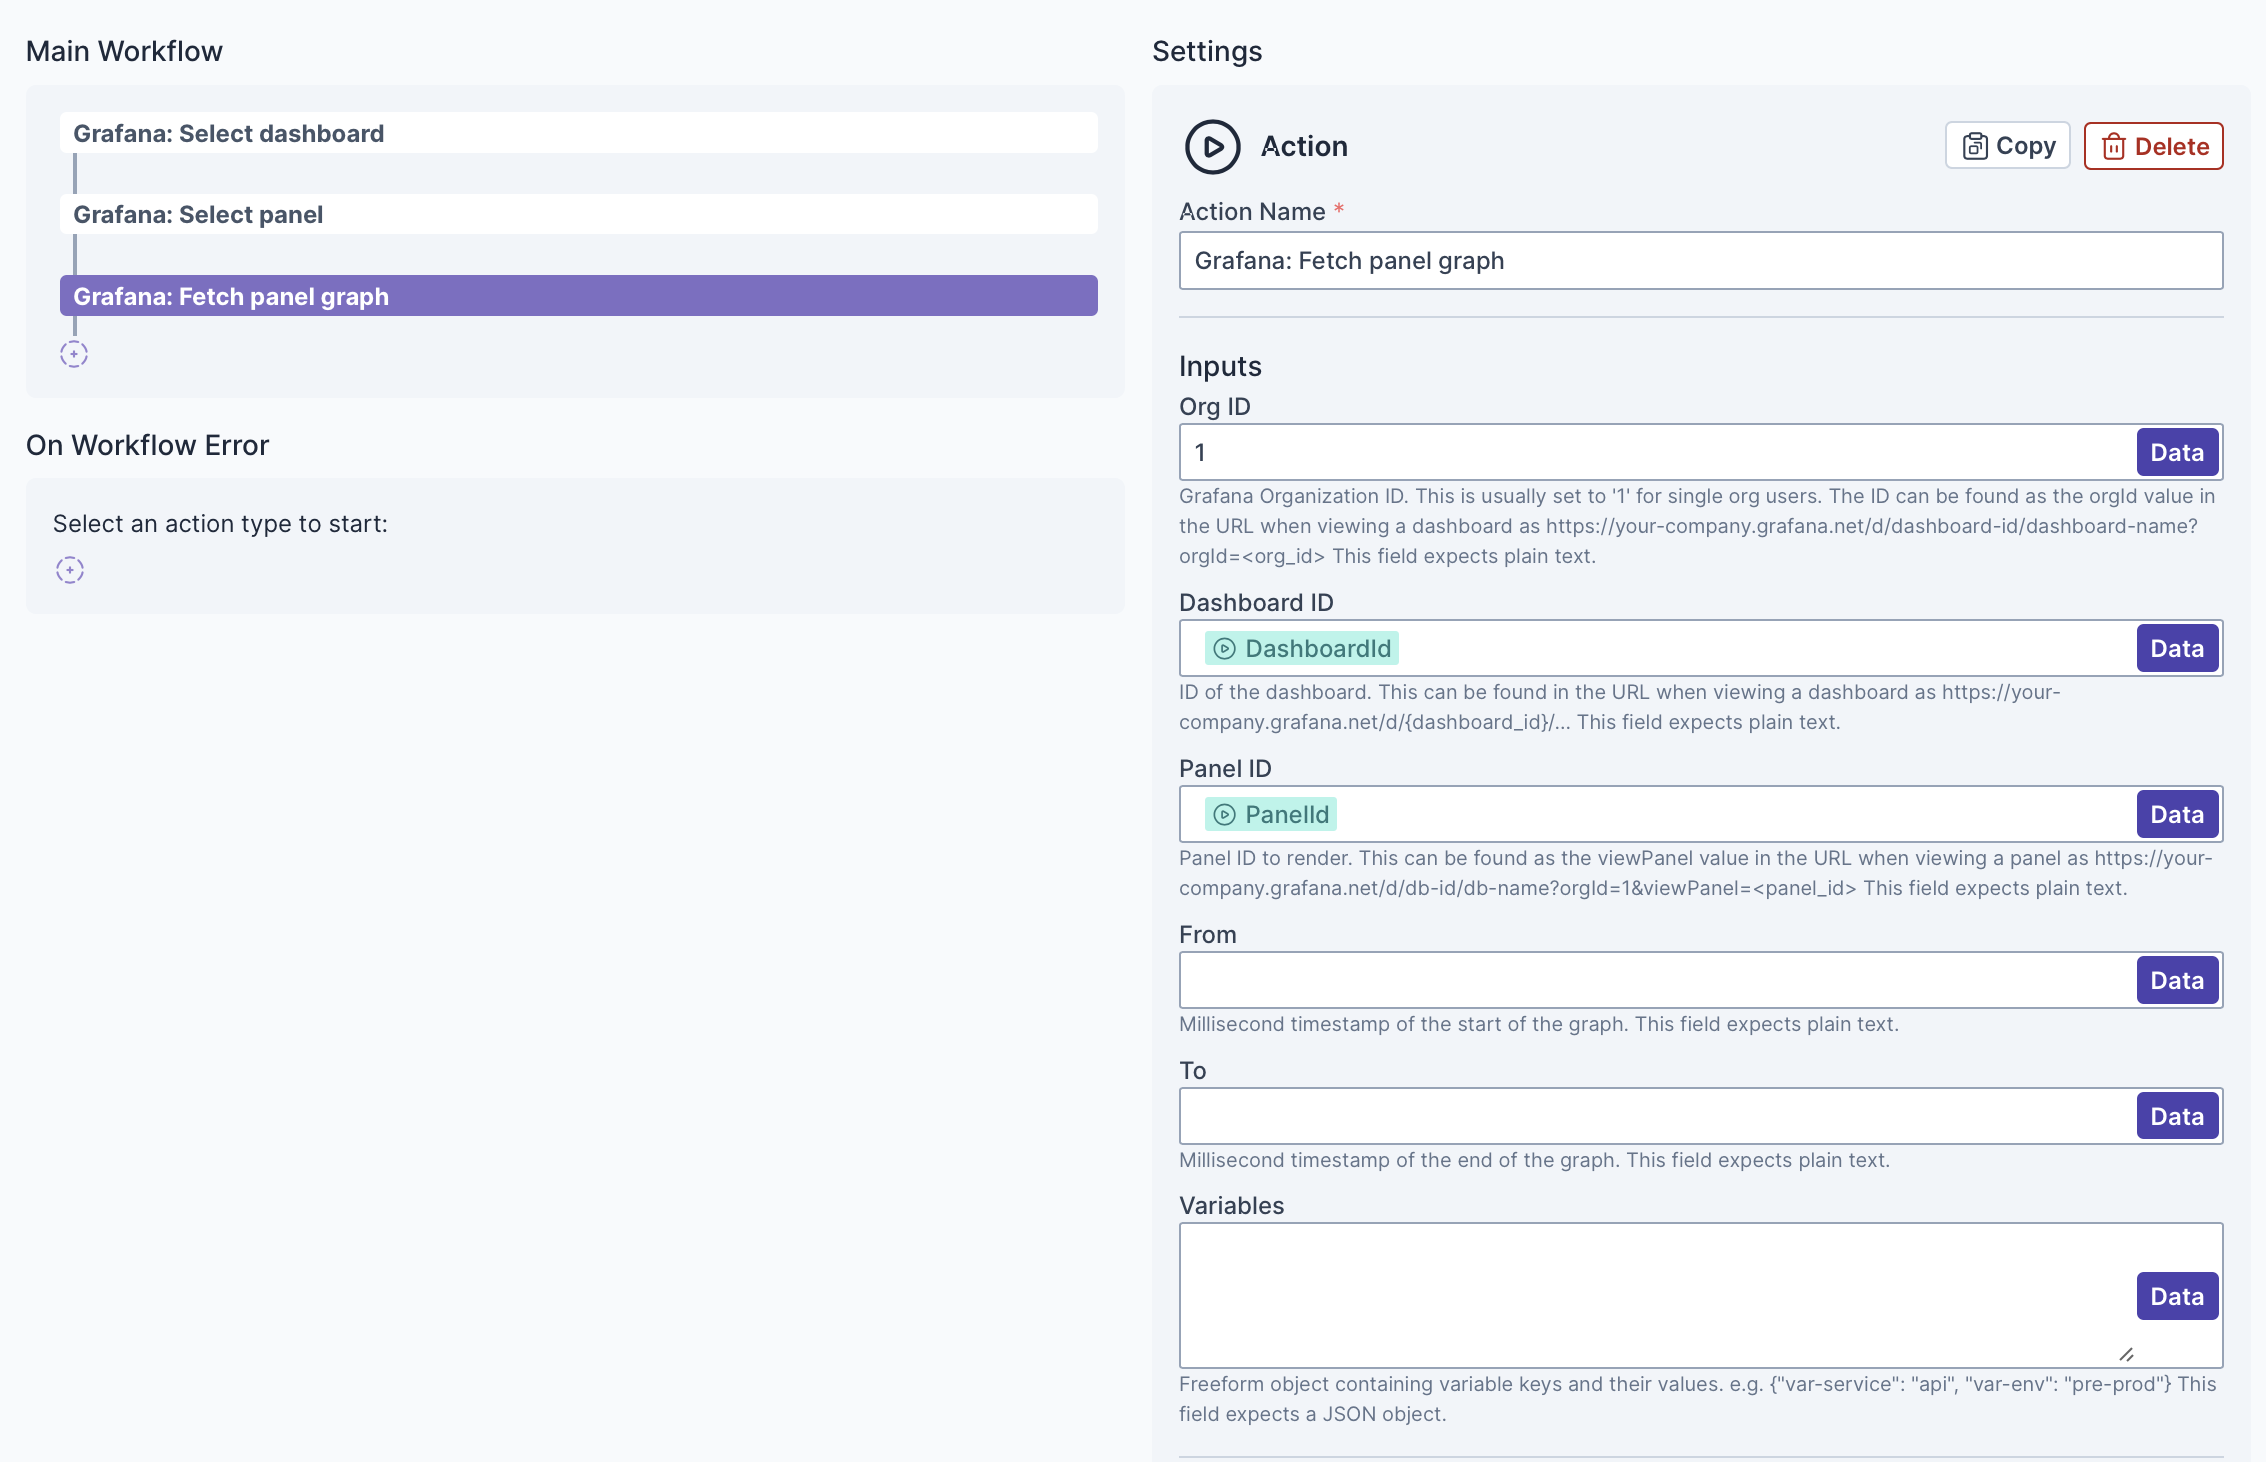
When you combine the Grafana actions, you can fetch panel graphs while letting Transposit provide the context for you, as shown below.
Test the Automation. For example, when you test the Fetch panel graph action, you see the following.